A few softwares have been developed in the context of oceanography. Here we cite those we have get to know which are currently being used within the community.

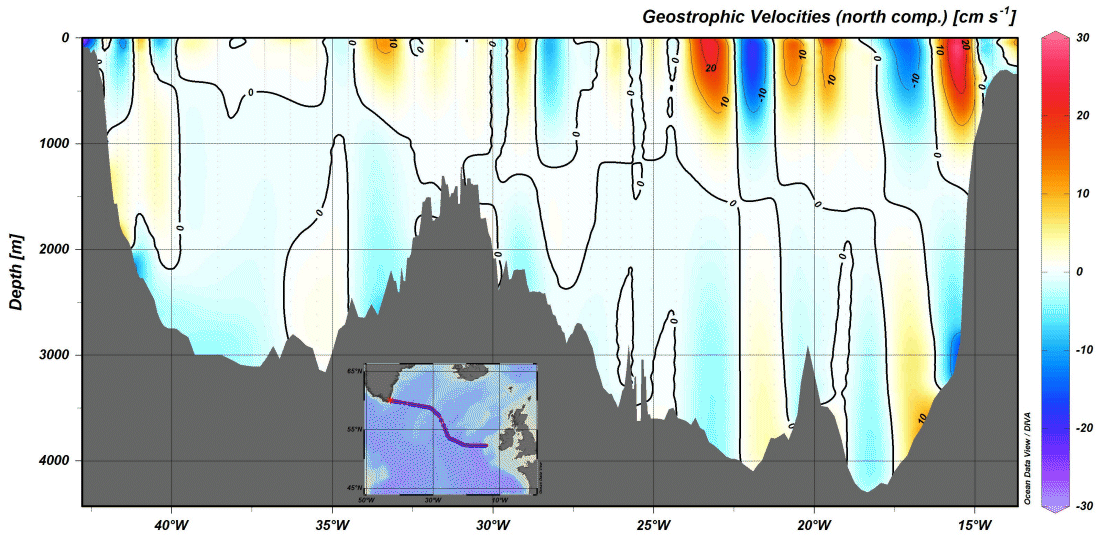
Ocean Data View (ODV) is a powerful software developed by Rudolf Schlitzer at the Alfred Wegener Institute for the visualization and analysis of oceanographic data. ODV supports various data types, including station profiles, time series, and sections. It enables users to create high-quality plots of parameters like temperature, salinity, oxygen, and chlorophyll. The software offers advanced interpolation tools for mapping data distributions and is compatible with formats such as NetCDF. Widely used by researchers worldwide, ODV is essential for exploring large datasets from sources like the World Ocean Database and Copernicus Marine Service.

Panoply is a cross-platform data visualization tool developed by NASA's Goddard Institute for Space Studies (GISS). It allows users to easily explore and visualize multidimensional datasets, including those in NetCDF, HDF, and GRIB formats. With Panoply, users can generate a variety of plots, such as global maps, time series, vertical profiles, and cross-sections. The tool supports data from climate models, satellite observations, and reanalysis products. Panoply is widely used in geosciences for quick data inspection and presentation, making it an essential tool for researchers working with Earth and ocean data.

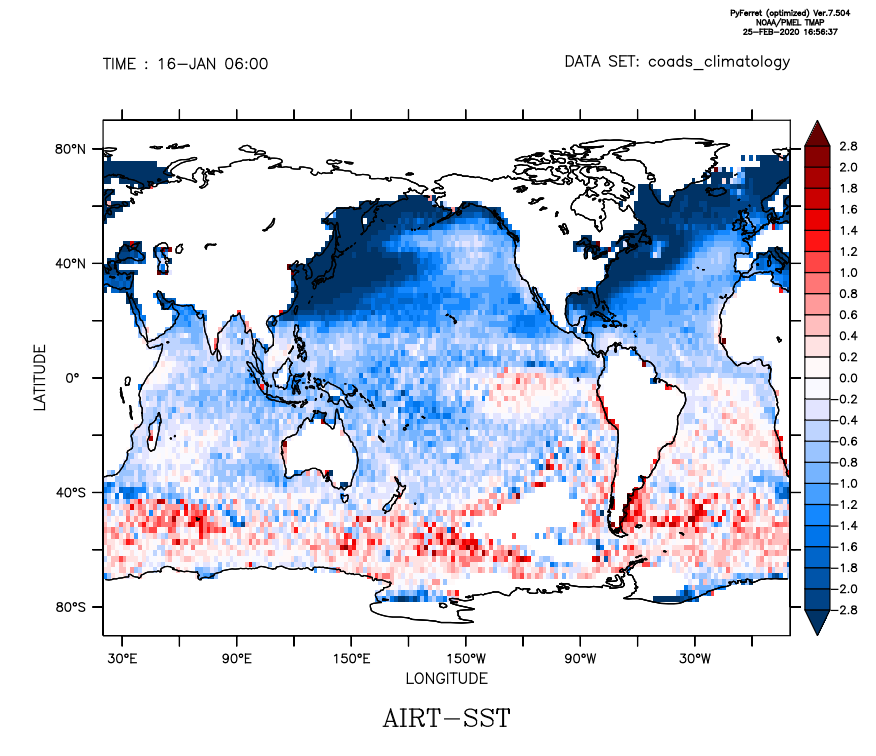
PyFerret is an advanced visualization and analysis tool that evolved from Ferret, originally developed by NOAA's Pacific Marine Environmental Laboratory (PMEL). PyFerret enhances Ferret’s powerful capabilities for handling large, multidimensional geoscience datasets by integrating Python support. It excels in plotting, analyzing, and modeling data from formats like NetCDF and GRIB, allowing users to create detailed maps, sections, and time series. PyFerret supports statistical operations, mathematical functions, and custom scripting, making it ideal for oceanography and climate research. Its flexibility and integration with Python enable seamless automation and expanded analytical capabilities.
On the other hand, oceanographic research often relies on a range of specialized programming languages and libraries to handle complex datasets and perform advanced analyses. Three main coding environments are widely used in physical oceanography: Python, R and Matlab. The following list highlights some of the most commonly used tools and repositories for oceanographic data processing and modeling.
Python

Several websites contain packages that provide code produced with Python to work in Physical Oceanography. Here we highlight some of them:
- https://oceanpython.org/: website to learn Python Programming Language for ocean- and marine-science applications and to share Python code.
- https://pyoceans.github.io/sea-py/: Python Tools for Oceanographic Analysis.
- https://currents.soest.hawaii.edu/ocn_data_analysis/index.html: data analysis with Python.
- https://oceanspy.readthedocs.io/en/latest/: OceanSpy - A Python package to facilitate ocean model data analysis and visualization.
- https://scrapbox.io/pycoaj/oceanography: Python for climatology, oceanograpy and atmospheric science.
- https://lijodxl.github.io/OceanographyWithPython/README.html: Python for data analysis in Oceanography.
- https://github.com/GliderToolsCommunity/GliderTools: package designed to process data from the first level of processing to a science ready dataset (delayed mode quality control).
R
R is likely the coding environment with less tradition in the field, so just a few packages are highlighted. If you know of any additional package, please, let us know!

- oce (https://dankelley.github.io/oce/): dedicated to oceanographic data handling (T-S diagrams, current analysis, etc.).
- argoFloats (https://github.com/ArgoCanada/argoFloats): Tools for downloading and analyzing Argo float profiles (temperature and salinity).
- https://mikkovihtakari.github.io/ggOceanMaps/: Plot data on oceanographic maps using ggplot2.
MATLAB
On the other hand, the physical oceanography community has a strong background in MATLAB. Numerous packages are available; here, we highlight the most relevant ones for use in a teaching context.

- TEOS 10 (https://github.com/TEOS-10/GSW-Matlab): code to work with the Thermodynamic Equation for Seawater, TEOS-10 (https://www.teos-10.org). Several utilities are also provided as part of the package.
- Sea-Mat (https://sea-mat.github.io/sea-mat/): A collaborative effort to organize and distribute Matlab tools for the Oceanographic Community.
- Seawater Toolbox (https://www.cmar.csiro.au/datacentre/ext_docs/seawater.html): despite the former equation for sea water is currently obsolete, this package also provide several utilities that might be useful for those who are trying to learn the basics of physical oceanography.
- M Map (https://www.eoas.ubc.ca/~rich/map.html): The classic toolbox for producing high-quality maps in Matlab, overlaying atmospheric and oceanographic observations.
- Global topography (https://topex.ucsd.edu/marine_topo/mar_topo.html): website to download the code needed to produce a high resolution bathymetry.
