On this day in history,...
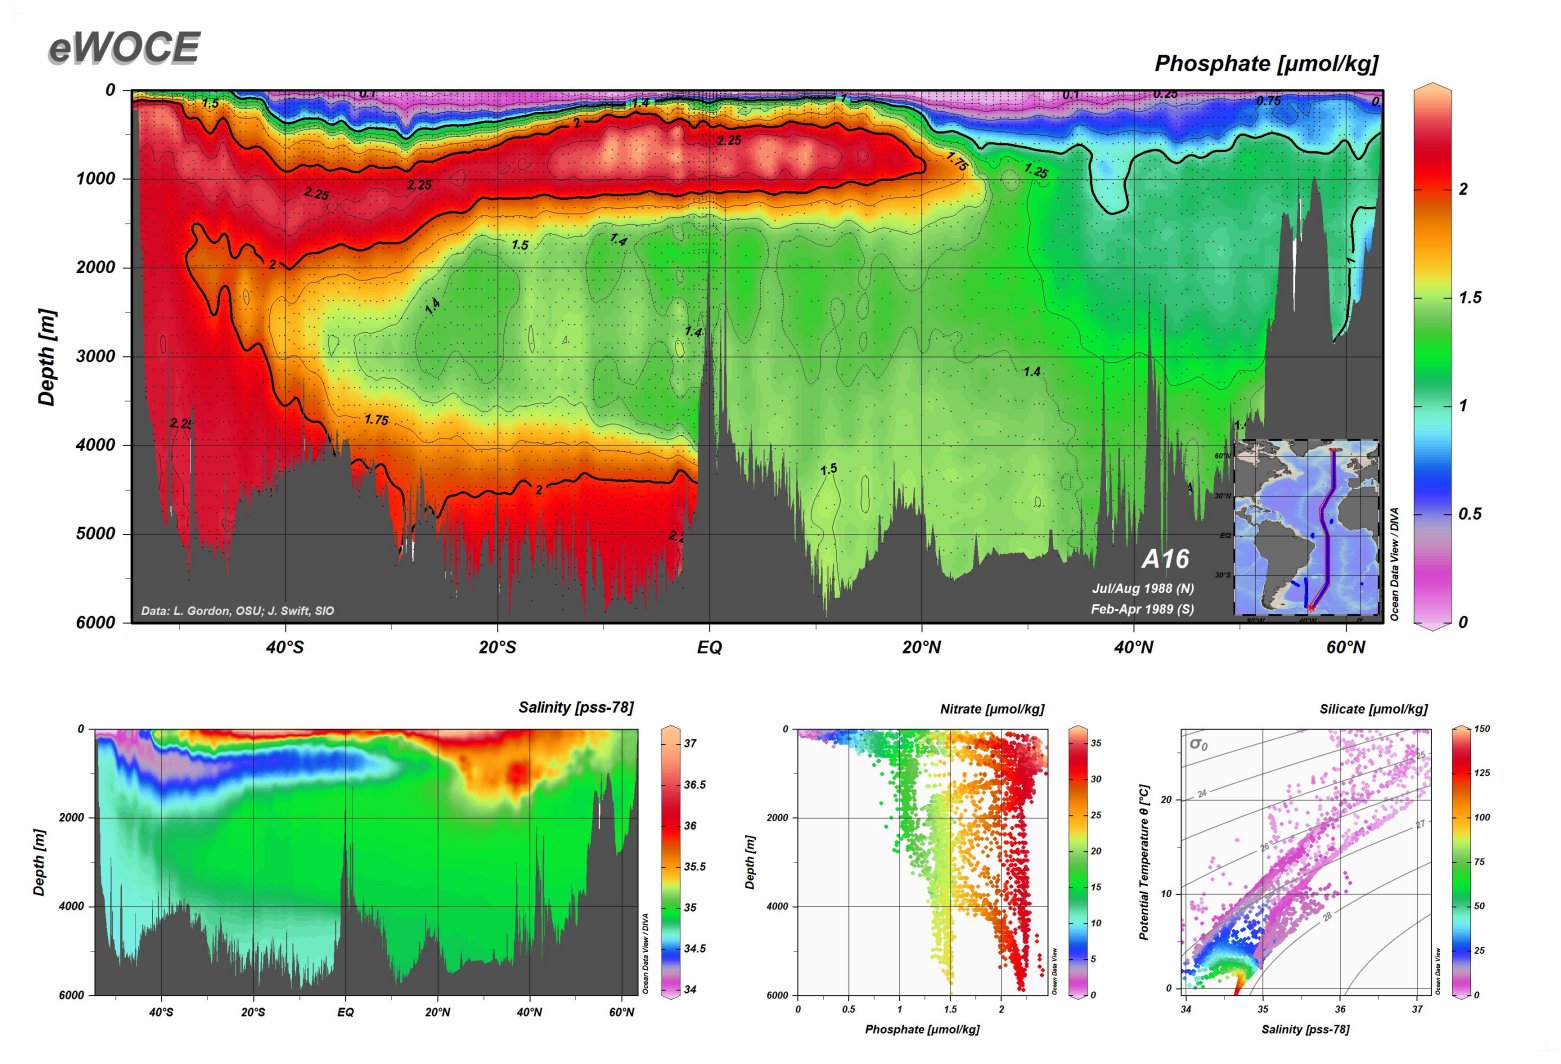
...in 2018, Ocean Data View (ODV) version 5.0 was released, marking a major milestone in the evolution of one of the most widely used tools for oceanographic data analysis and visualization. ODV, developed by Reiner Schlitzer at the Alfred Wegener Institute for Polar and Marine Research, has become an essential software for handling hydrographic datasets, allowing scientists to explore, analyze, and graphically represent oceanographic data efficiently.

Although this date corresponds to the release of version 5.0, we acknowledge that ODV was originally launched much earlier. If anyone has the precise date of its first release, we would be happy to update this record accordingly.
ODV has revolutionized the way oceanographers handle large datasets, offering powerful interpolation methods, interactive plotting, and compatibility with major oceanographic data repositories such as the World Ocean Database (WOD), Argo, and GEOTRACES. It has been instrumental in fields such as climate studies, marine biogeochemistry, and physical oceanography, allowing researchers to analyze spatial and temporal variability in ocean properties like temperature, salinity, and dissolved oxygen.
ODV has been referenced in numerous studies and is widely adopted by the oceanographic community due to its flexibility, cross-platform compatibility, and ability to process large datasets with minimal computational resources. The software has contributed significantly to global ocean data standardization and accessibility, facilitating collaborative research and long-term monitoring of ocean changes.
Sources
- Brown, M. (1998). Ocean Data View. Oceanography, 11(1), 19-21. DOI: 10.5670/oceanog.1998.04
- Schlitzer, R. (2002). Interactive analysis and visualization of geoscience data with Ocean Data View. Computers & Geosciences, 28(10), 1211-1218. DOI: 10.1016/S0098-3004(02)00040-7
